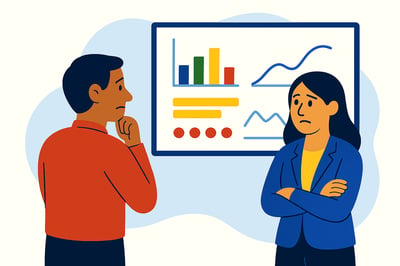
Most organizations measure leadership success through numbers like retention rates, productivity, engagement scores, and quarterly performance data. Those metrics matter, but they only tell half the story. They measure outcomes, not the behaviors that create them.
The problem? When you only track results, you miss the patterns driving them. You reward what’s visible and overlook what’s real. MyHardWired is built on behavior and doesn’t just count what leaders do.
It reveals why they do it, and how that wiring shapes every result.
The Metrics That Miss the Mark
Most performance dashboards are full of lagging indicators: turnover, morale, output, and deadlines met. They show what already happened. But behavior is a leading indicator. It predicts where performance is heading before the numbers catch up.
When metrics ignore behavior, leaders fall into three traps:
- Overvaluing results while undervaluing consistency. A leader who drives short-term gains through pressure may burn out the team by quarter’s end.
- Confusing visibility with impact. Charismatic leaders often get high engagement scores, while quieter, steady leaders build the systems that sustain real performance.
- Ignoring stress behavior. Teams look fine on paper until pressure hits. That’s when Instinctive Modes surface and communication breaks down.
👉 Learn how MyHardWired shifts leadership measurement from labels to patterns
Behavior Is the Missing KPI
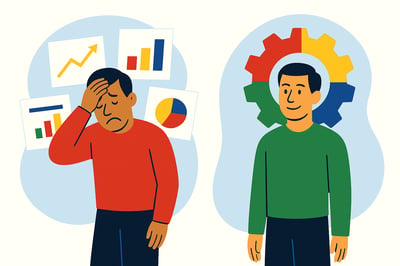
Traditional metrics measure what leaders accomplish. Behavioral metrics measure how they get there. The difference determines whether performance lasts.
Consider two leaders:
- One achieves results through directness and urgency (Red Preferred Mode).
- Another through structure and precision (Green Preferred Mode).
If you evaluate both by the same metric say, “decisiveness under pressure,” you miss the point. Each has a different behavioral path to confidence and results. Measuring them on the same curve leads to misjudgment, stress, and poor succession decisions.
Behavioral insights, like those revealed by MyHardWired, make leadership measurable in 3D:
- Preferred Mode shows where leaders perform at their best.
- Expectations Mode reveals how they believe they “should” lead.
- Instinctive Mode uncovers what happens under stress.
Together, they form a predictive map.
Something no engagement survey or KPI dashboard can capture.
When Metrics Fail in Real Life
A global healthcare company once celebrated a senior leader for “driving performance.” Metrics were strong. Sales were up, deadlines were hit, and meetings on time. But turnover quietly climbed. Team engagement dropped. Stress leaves spiked.
Behaviorally, that leader’s wiring was heavy in Red (results-driven) and Green (structure-focused). Under stress, her Instinctive Mode tightened control. Her team, mostly Yellow (people-driven), felt unseen and stifled.
The metrics said “success.” The behavior said “crisis.”
It wasn’t until they introduced the MyHardWired behavioral assessments that the pattern became clear. When the leader learned to delegate and build team connection intentionally, performance rebounded with sustainably this time.
👉 Reviewing metrics? Look for behavior-led indicators
What to Measure Instead
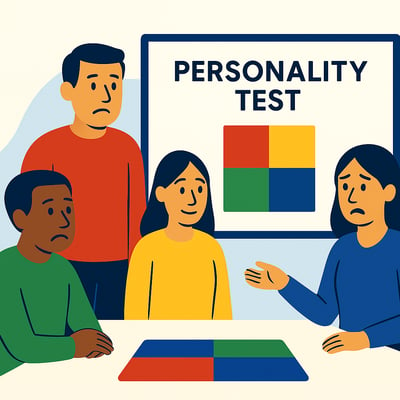 Leaders and HR teams can begin tracking new indicators that actually predict health and performance:
- Behavioral Alignment: How often are leaders operating in their Preferred Mode? How frequently are they forced to shift into stress-driven Instinctive behavior?
- Trust Consistency: Are leaders predictable in their communication style? Do teams know what to expect, even when things go wrong?
- Energy Indicators: Do team members report feeling energized or drained after key meetings? Is the leader balancing their own behavioral needs while leading others?
- Adaptive Communication: How well does the leader match their communication style to the listener’s wiring? Do they create clarity across behavioral differences or amplify confusion?
- Stress Predictors: What behavioral patterns show up before conflict or disengagement? Are stress signals identified and managed proactively?
These aren’t “soft” metrics. They’re measurable, observable, and directly linked to performance outcomes.
The Role of Behavior in Sustainable Performance
When behavior becomes part of leadership metrics, you stop rewarding burnout and start reinforcing alignment.
Executives use it to see where leadership gaps really exist.
HR Directors use it to link development to measurable shifts in behavior.
Consultants use it to predict client friction before it shows up in results.
Behavior becomes the foundation for better metrics because it’s what drives every number you care about.
Reflection Prompts
- Which leadership behaviors in your organization consistently predict strong results?
- Where do your metrics miss early warning signs of stress or disengagement?
- If you measured alignment instead of output, how would your leadership rankings change?
- What would shift if every metric also told you why those numbers exist?
Unlock the Metrics That Actually Matter
You’ve seen how traditional KPIs track outcomes, not behavior. But sustainable success starts with knowing what’s underneath those numbers.
Get The Guide
Next Steps for Real Alignment
For Individuals → See the behavioral metrics that reveal your true strengths and stress responses
For Teams → Redefine success through behavior-based KPIs that link directly to performance
For Consultants → Help clients predict performance by measuring behavioral alignment before results shift